Your Fire & Gas report, in 31 languages or two side by side
Build the Word report for your Fire & Gas mapping study in one language, or in two languages in the same document, with coverage tables, detector lists and plots.
9 min read
Kryptos generates a Word document, with every area, its grades, its detectors and the coverage they reach. Tables and pictures are numbered and listed for you, in 31 languages that Kryptos supports.
You can generate a report in a single language, choosing from any of 31 supported languages, or in two languages with the paragraphs displayed side by side. This guide sets up a report from start to finish and shows what each choice does to the document you get.
Step 1: Check every mapping is ready
The report shows two configurations for each mapping: the Preliminary Configuration (where you started) and the Final Configuration (what you are handing over). Other configurations you tried along the way stay in Kryptos and are not in the report.
The quickest way to see what is missing is the project status. On the Modelling tab, click View Status.
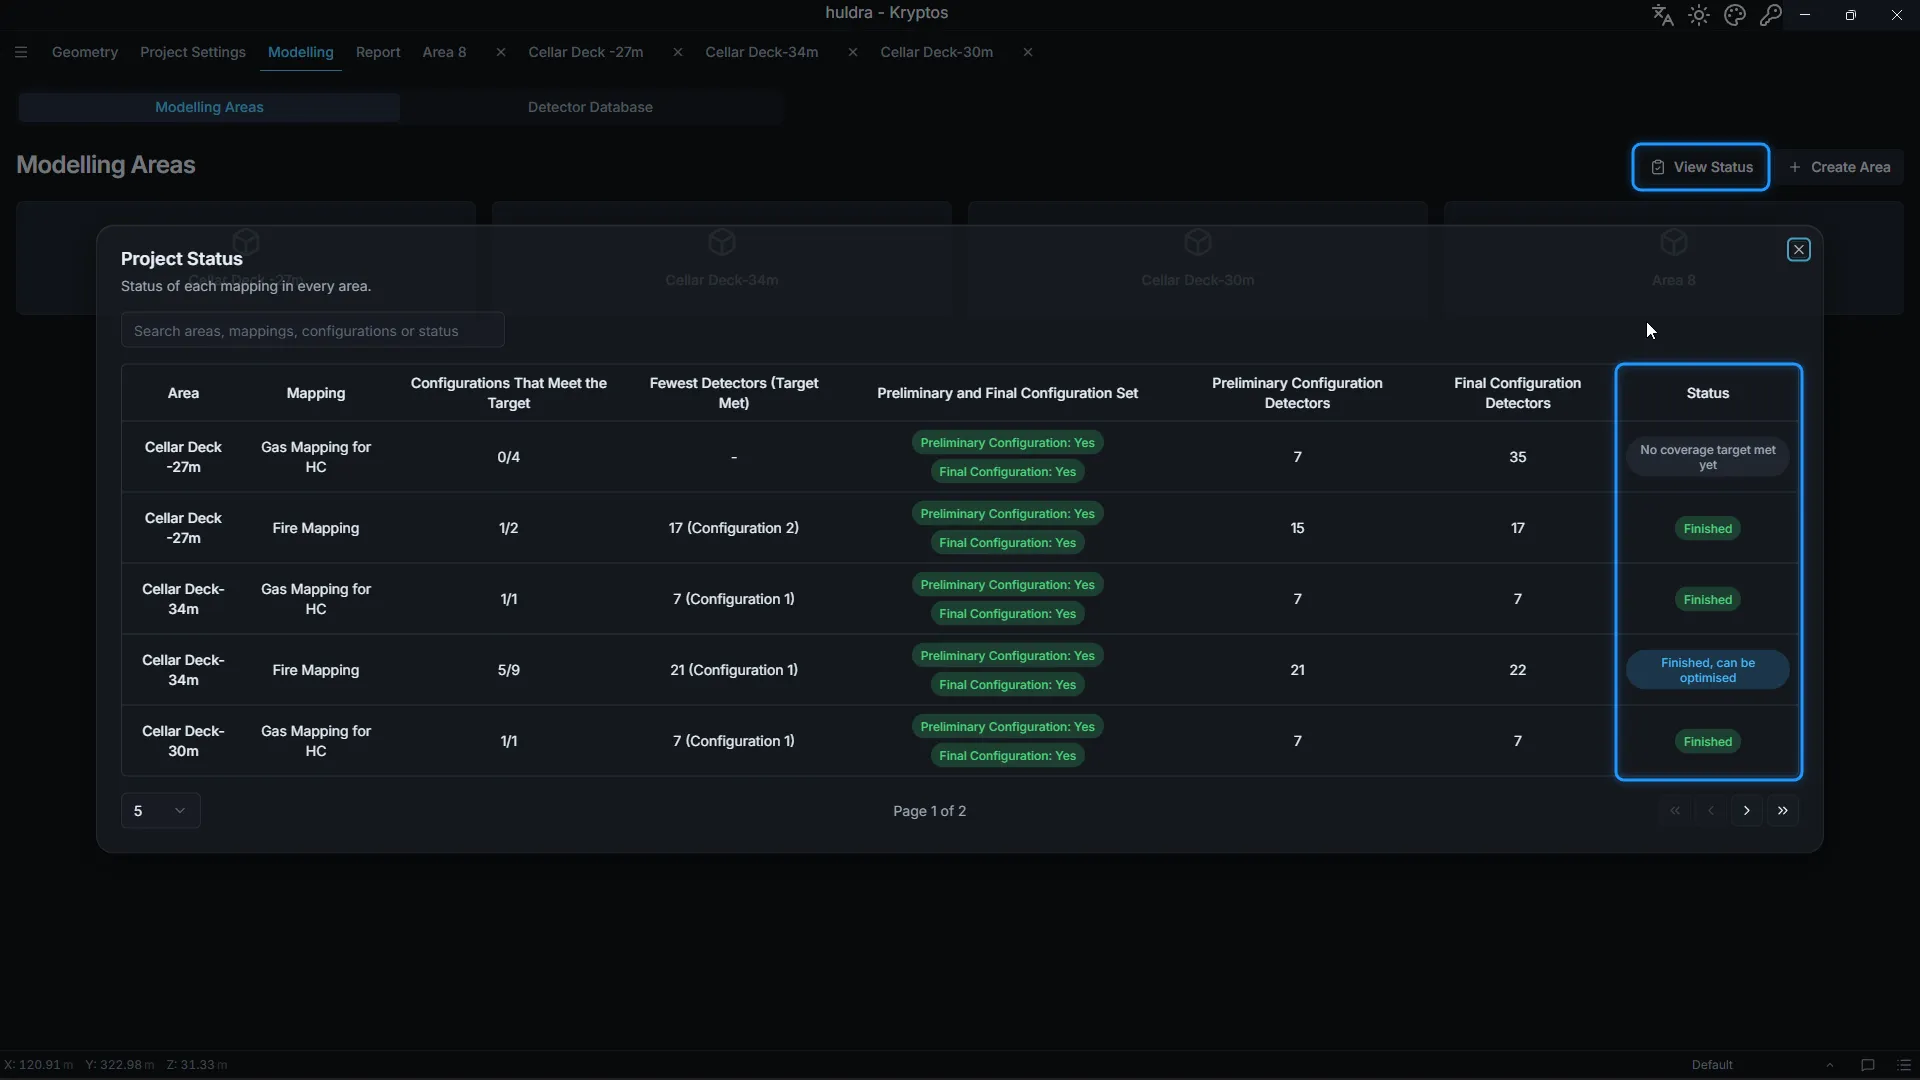
For every mapping in every area, it shows:
- How many configurations meet the coverage target, and which one does it with the fewest detectors.
- Whether the Preliminary Configuration and Final Configuration are set, and how many detectors each has.
- A status that says what to do next:
| Status | What it means |
|---|---|
| Finished | The Final Configuration meets the target, and no other configuration does better. |
| Finished, can be optimised | The Final Configuration meets the target, but another configuration meets it with fewer detectors or better coverage. Choosing that one as the Final Configuration would be better. |
| Not finished | The Final Configuration does not meet the target yet. |
| Preliminary and Final Configuration Missing | A configuration meets the target, but none is chosen as the Final Configuration. |
| No coverage target met yet | No configuration meets the target. Keep working on one until it does. |
Use the search box to find one area or mapping, and the arrows at the bottom to page through a large project.
Step 2: Set the Preliminary Configuration and Final Configuration
For each mapping the status flags:
- In the area tree, select the configuration that you consider preliminary.
- Click Set Configuration in the ribbon, then Set Config as Prelim.
- Select the configuration that you consider as final, click Set Configuration again and choose Set Config as Final.
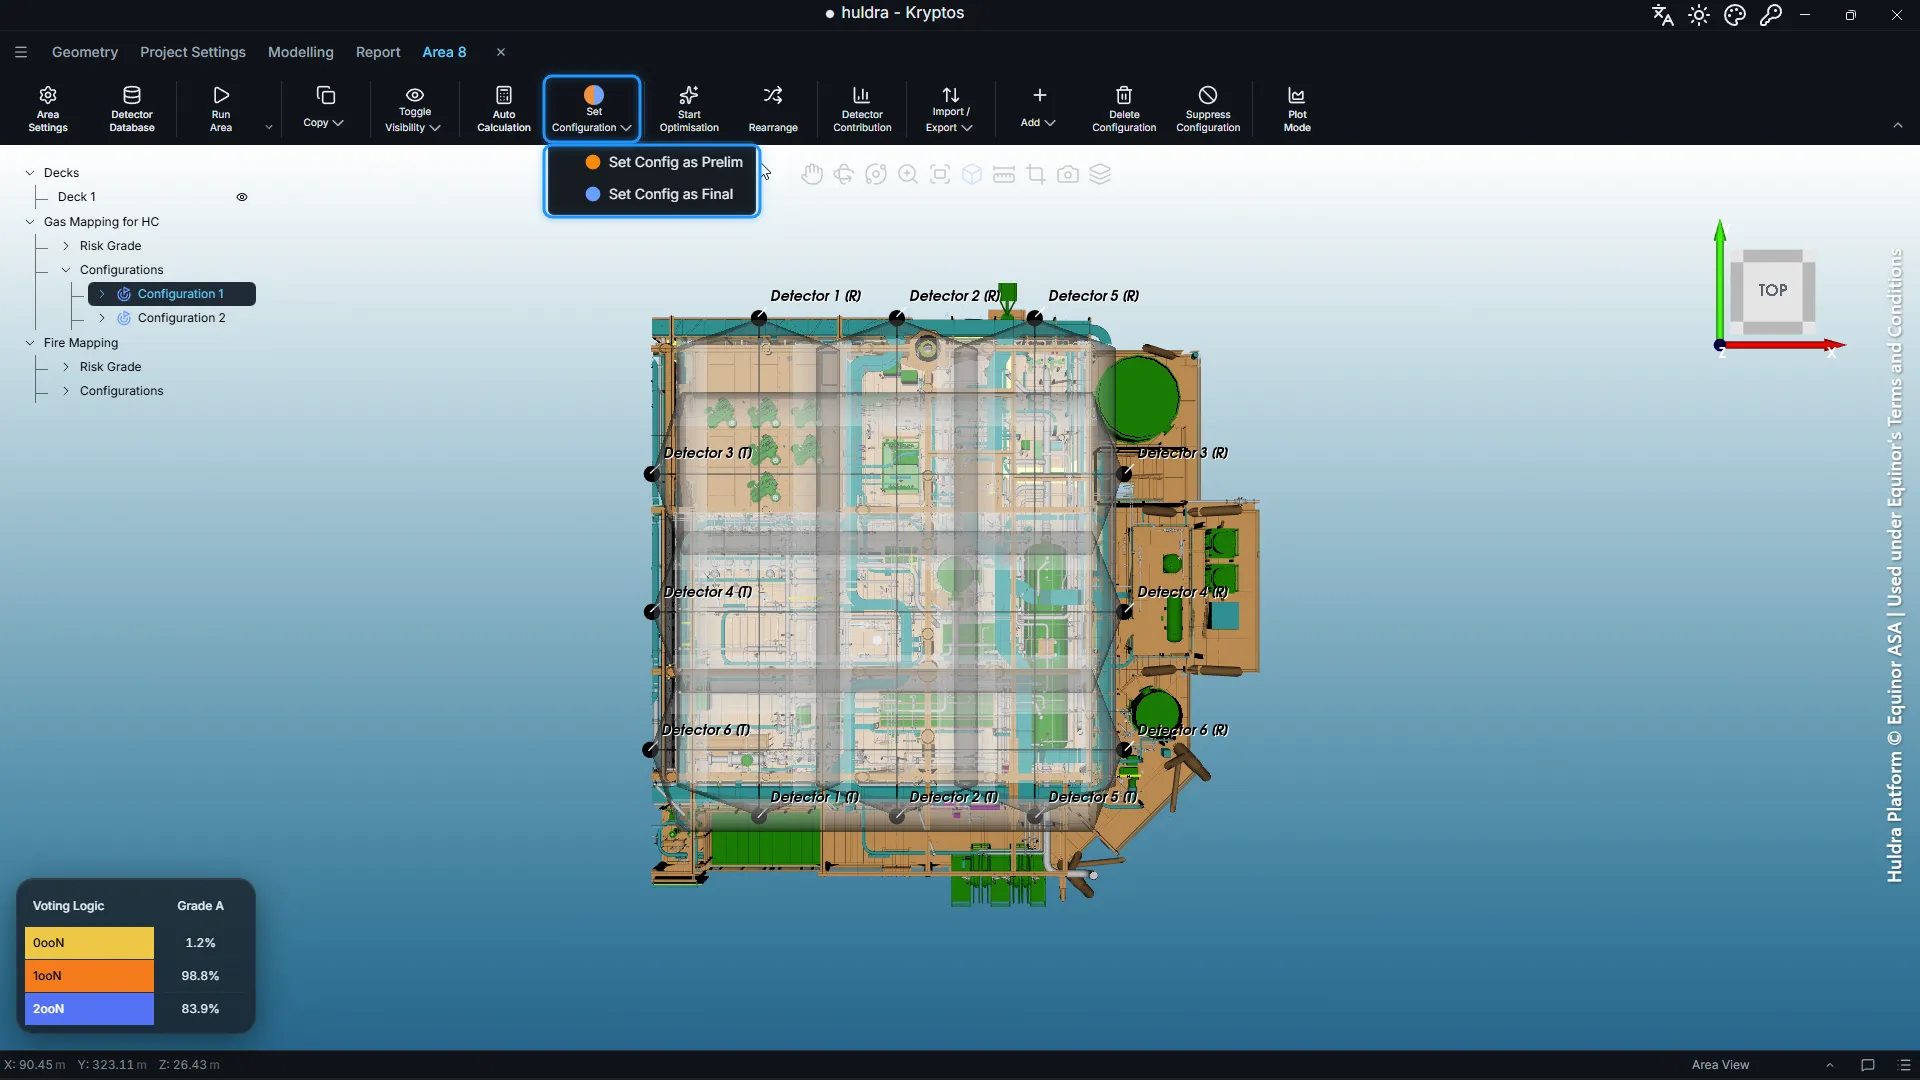
In the tree, an orange dot marks the Preliminary Configuration and a blue dot the Final Configuration, so you can check them at a glance.
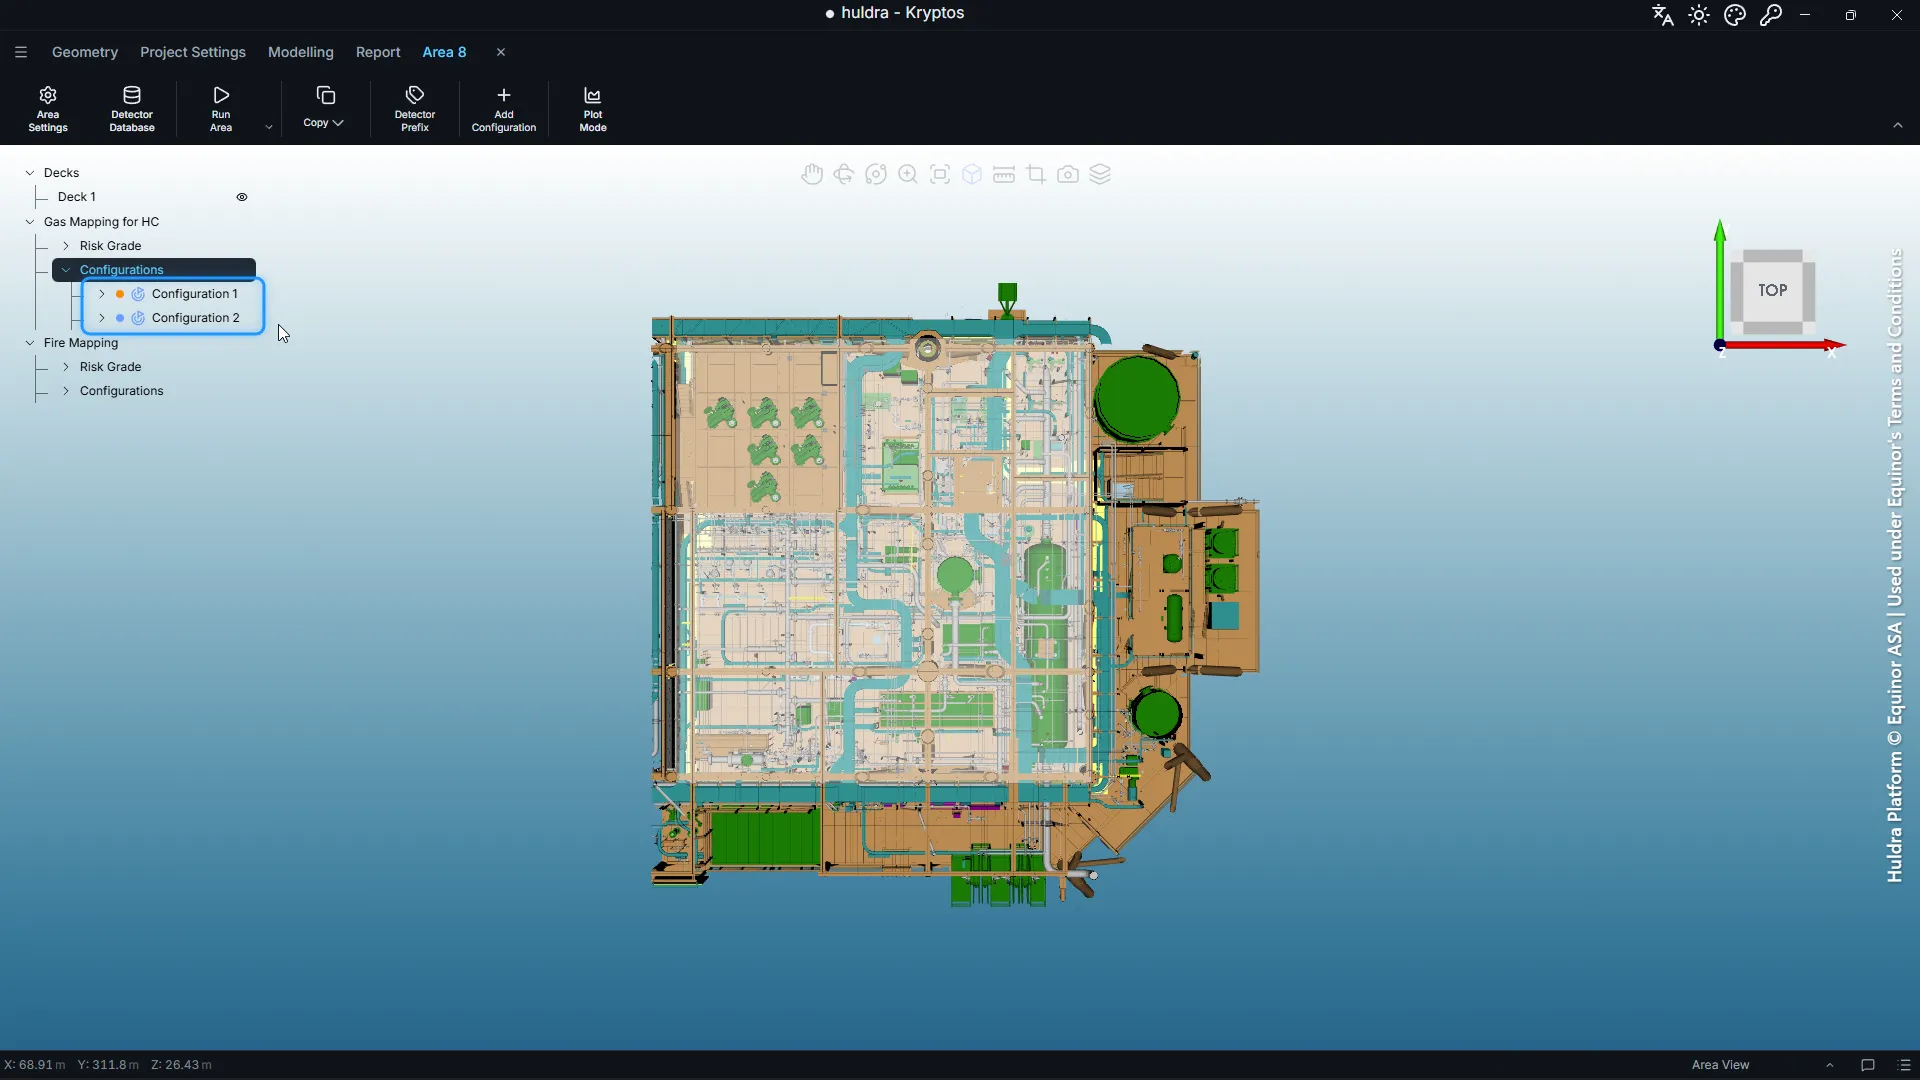
Then click Run Area so both are calculated. If a Preliminary Configuration or Final Configuration has no results, Kryptos tells you before it starts the report. For more on what each one means, see Preliminary and Final Configurations in the Kryptos documentation.
Step 3: Open the report settings
Open the Report tab and click Report at the top. The settings are grouped from top to bottom: page numbers, plots, areas and language. Generate Report is at the top right.
Step 4: Page numbers
Your report often goes into a bigger study document, as an appendix or a chapter. The page numbers can follow on from the pages around it.
- Page Number Prefix goes in front of every page number. Use it for an appendix letter or a section number.
- Starting Page Number sets the number of the first page.
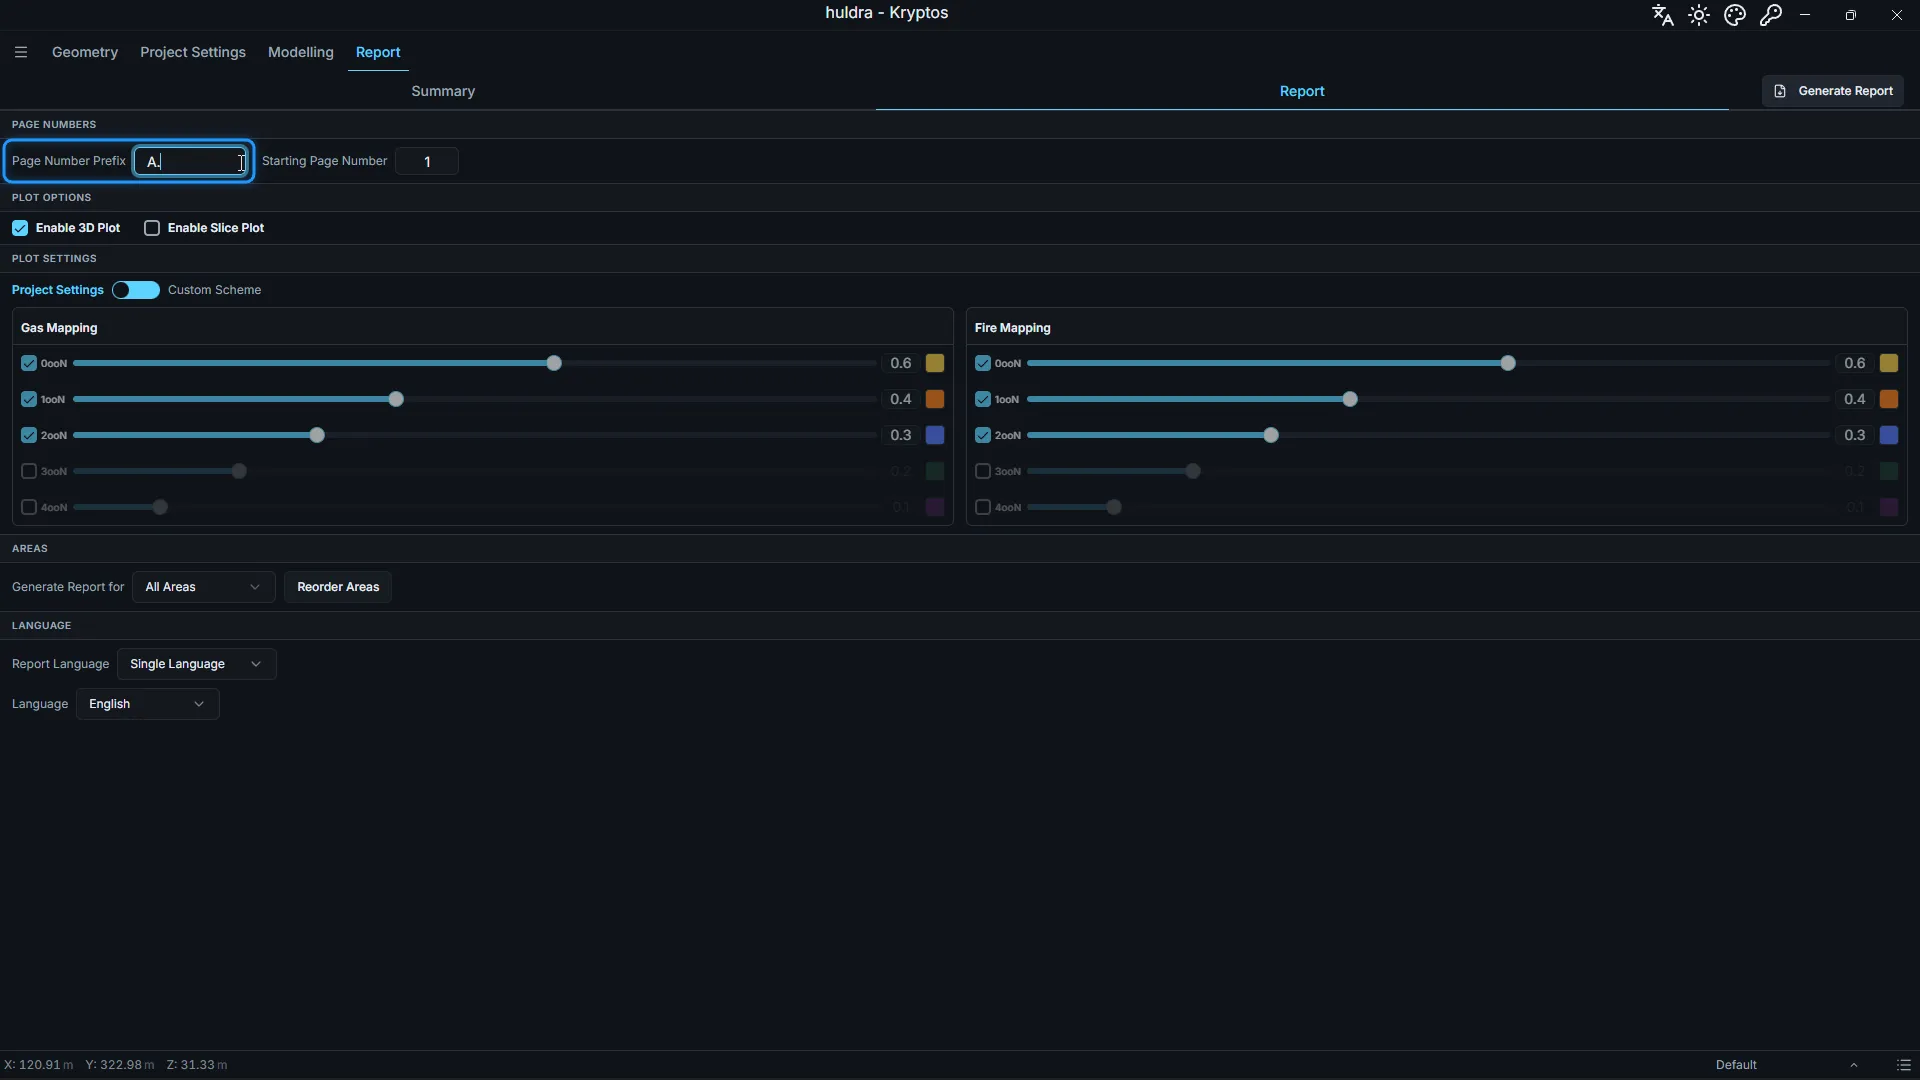
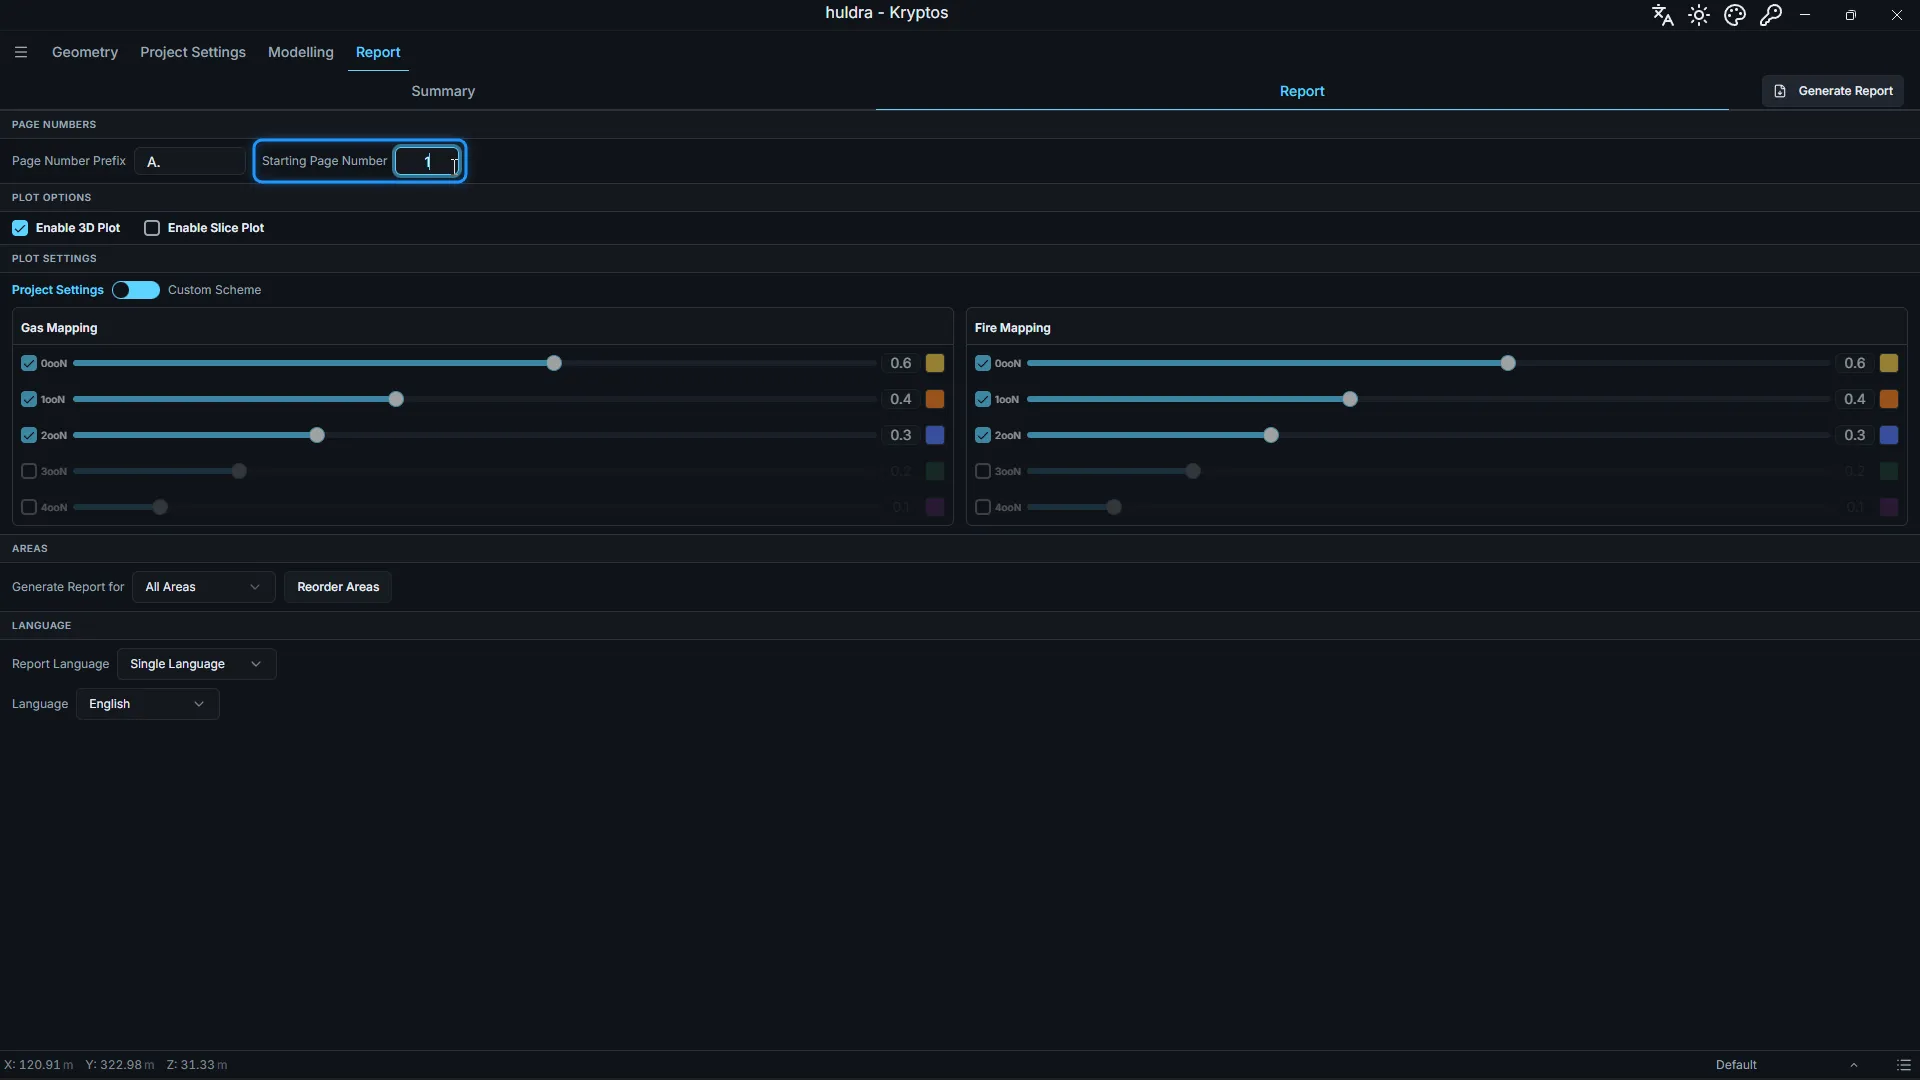
With a prefix of A. and a start of 1, the pages are numbered A.1, A.2, A.3 and so on. If the appendix starts on page 5 of the bigger document, set the start to 5.
Step 5: Plots
The plots show where each mapping is covered and where it is not, coloured by how many detectors see each spot.
- Enable 3D Plot adds a 3D view of the coverage for each configuration.
- Enable Slice Plot adds slice plots (2D) through the area. For slice plots, tick the planes you want and set Slice Delta, the gap between two slices.
For more on how each plot works, see 3D Plot and Slice Plot in the Kryptos documentation.
Plots make the report longer and take more time to build, so switch on only the ones you need.
Tip: A small Slice Delta on a tall area can make hundreds of plots. Start large and go smaller only if you need more detail.
Plot colours
Under Plot Settings, choose the colours of the plots in the report:
- Project Settings uses the colours and transparency you already see in the app, so the report always matches the model. They are shown here but cannot be changed.
- Custom Scheme lets you pick colours and transparency for the report only, without changing anything in your project. It starts from your project colours, so nothing is blank.
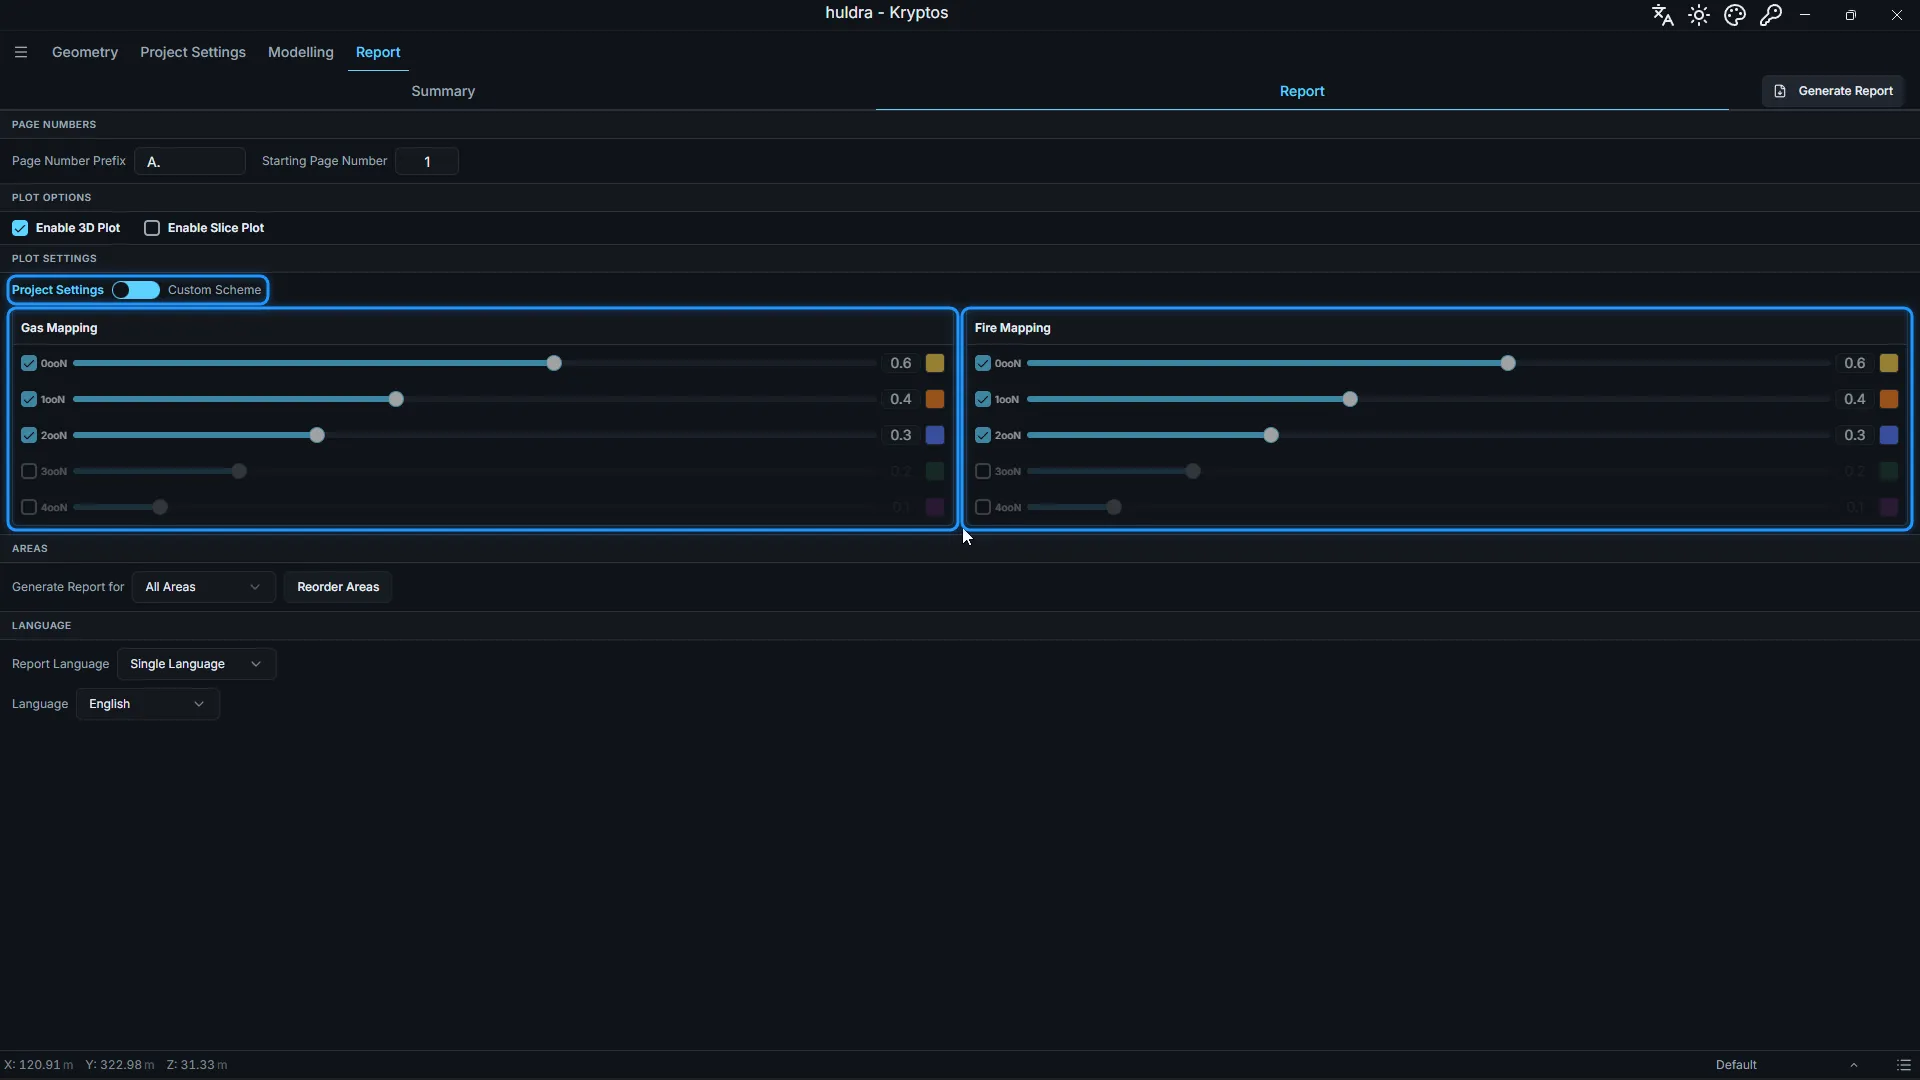
With Custom Scheme, each voting level (0ooN, 1ooN, 2ooN and so on) has its own row for gas and for fire. Tick or untick a level to show or hide it, click the colour box to pick a colour, and move the slider to make it more or less see-through. Sync gas and fire makes a change to one apply to the other too.
Step 6: Areas
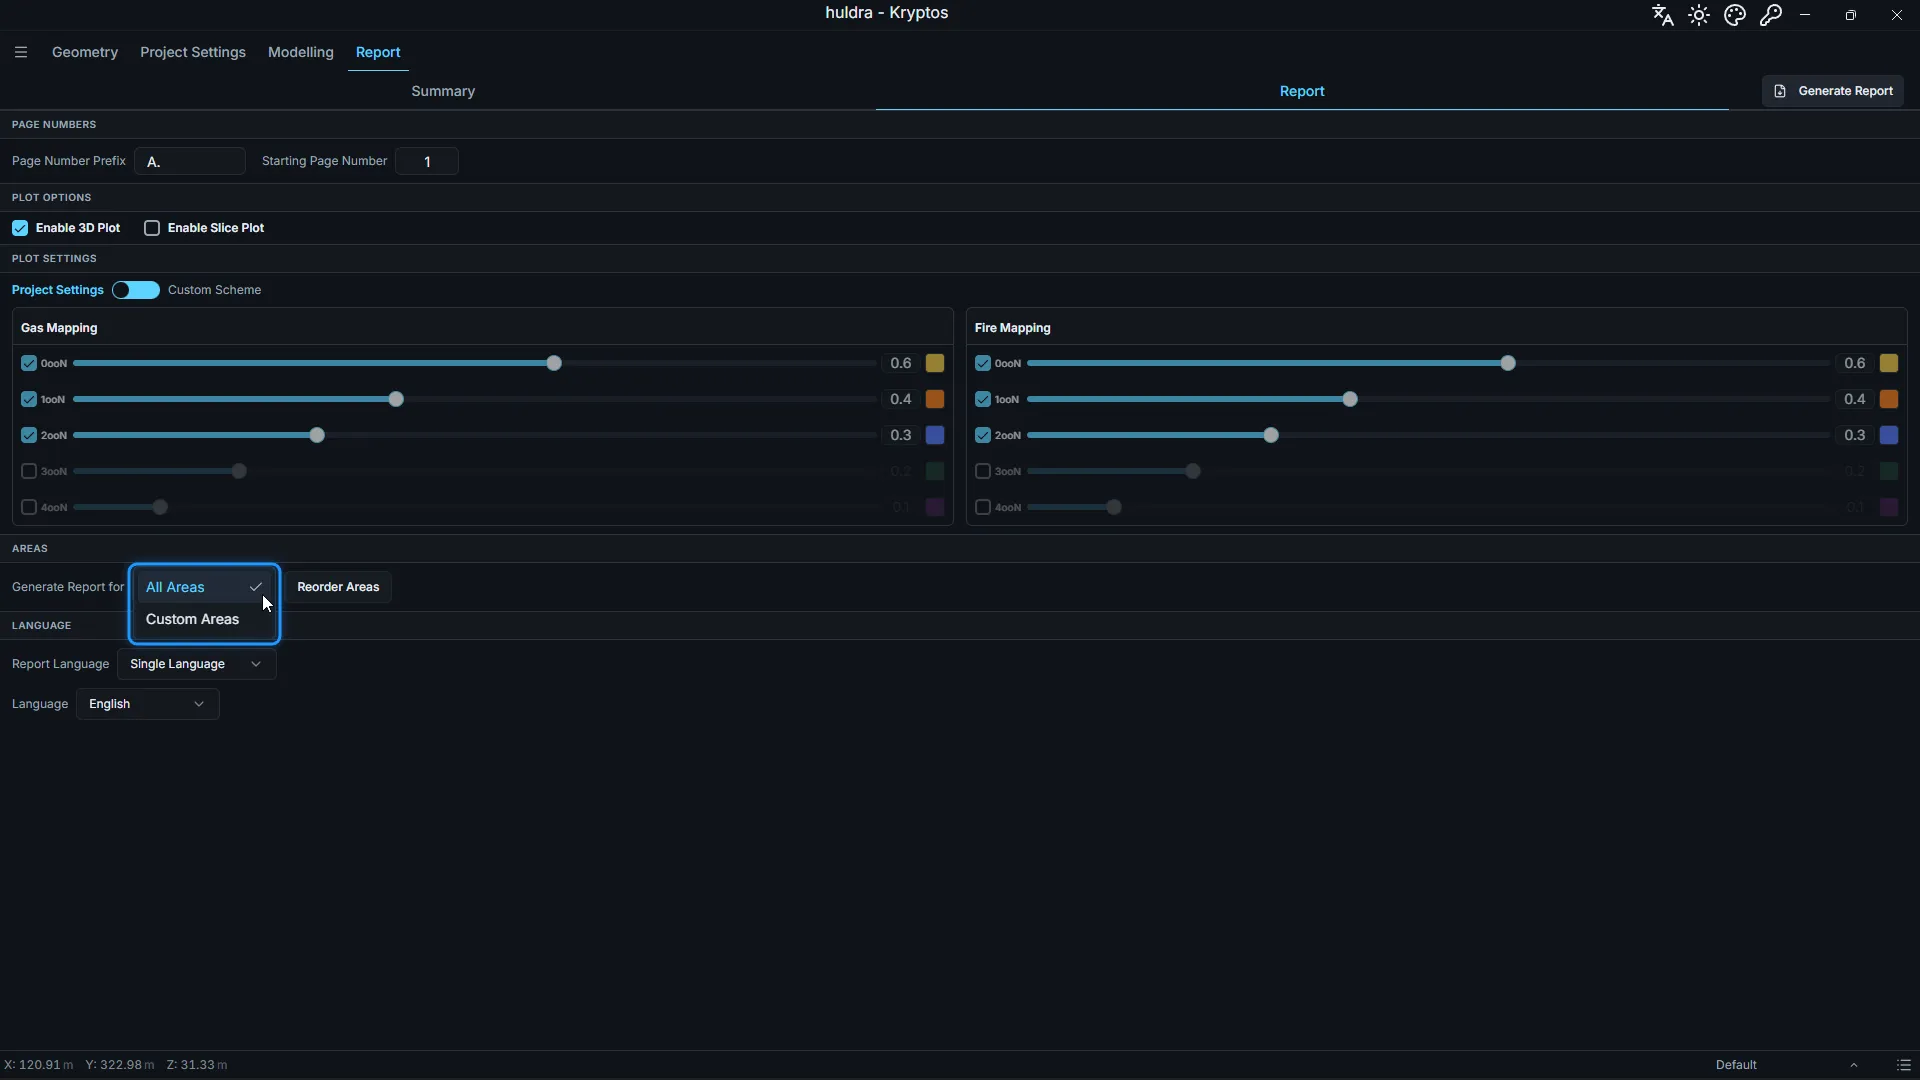
Generate Report for decides which areas go in.
- All Areas puts in every area in the project.
- Custom Areas lets you pick some. A list opens with every area, and (Select All) at the top. Pick at least one, or Generate Report stays greyed out.
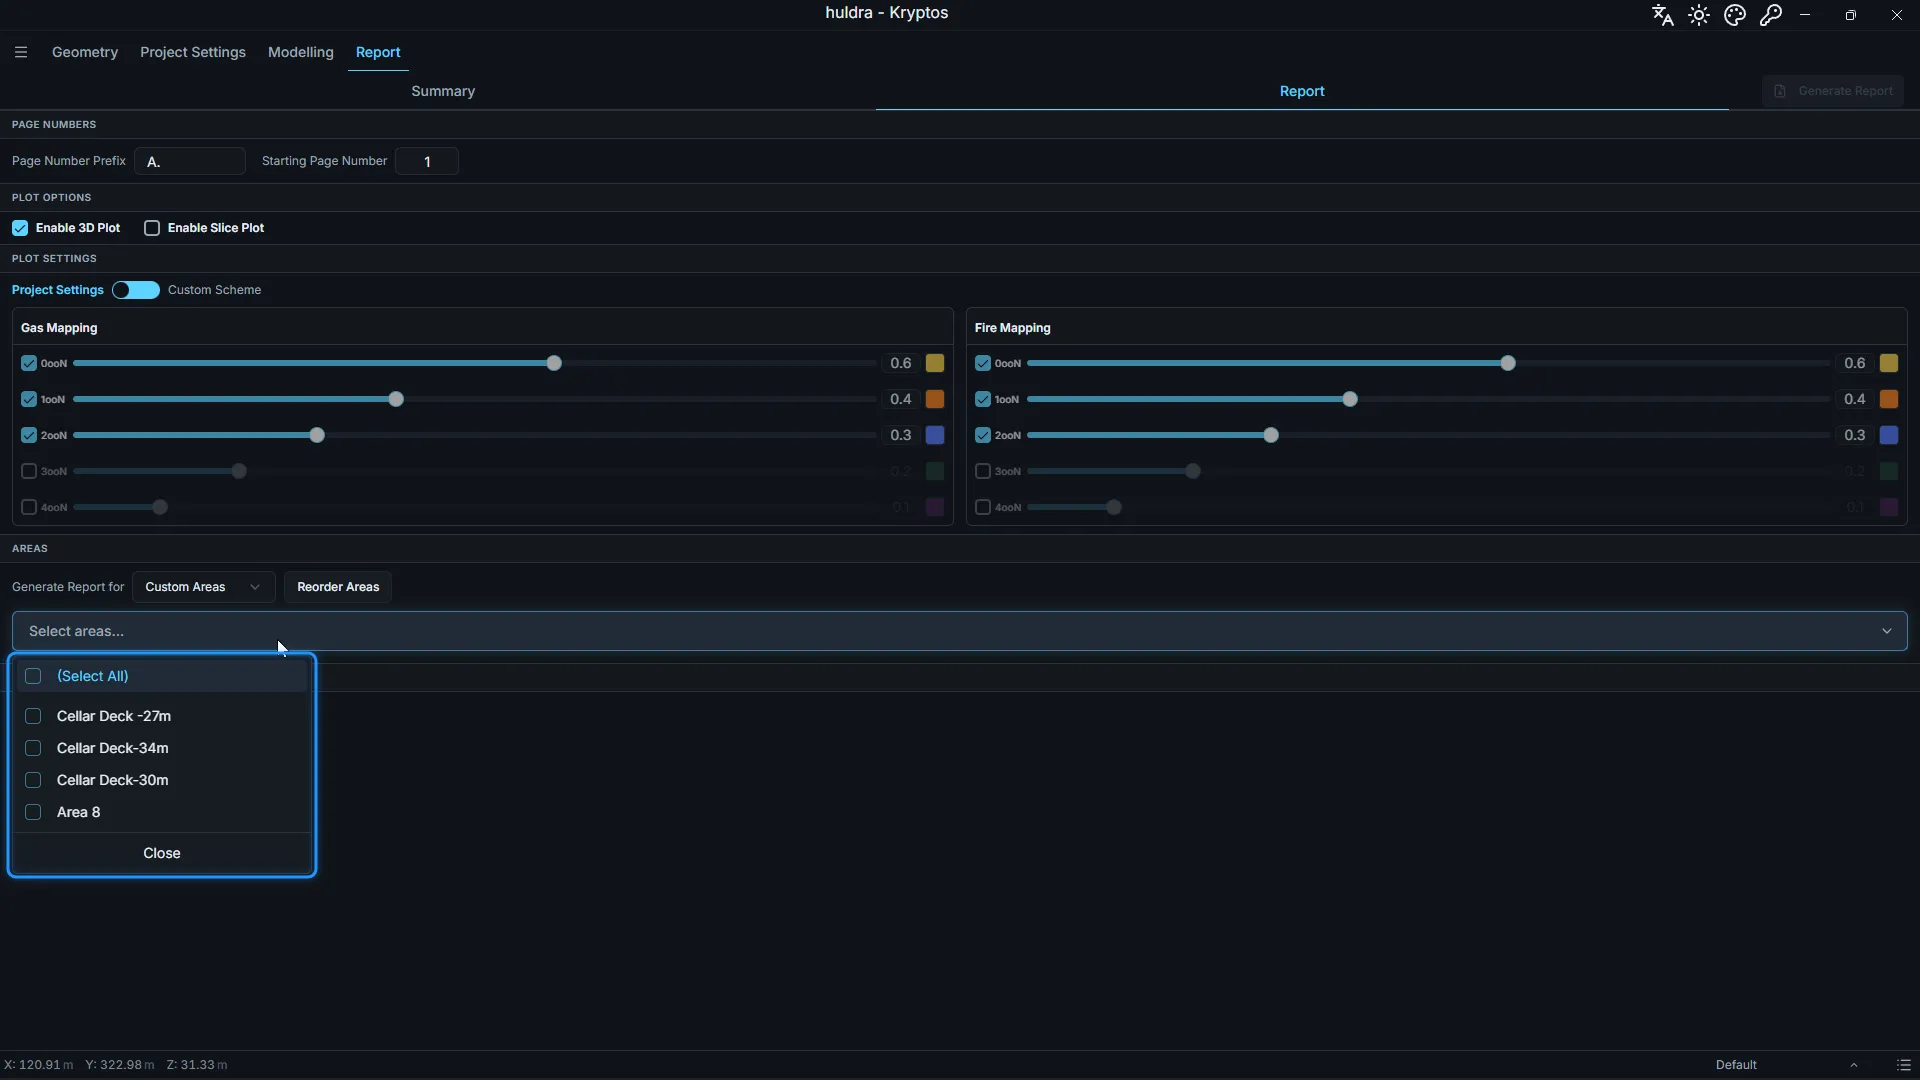
Picking areas is useful when a client wants one module at a time, or when you are checking one area before you send the whole report.
Reorder the areas
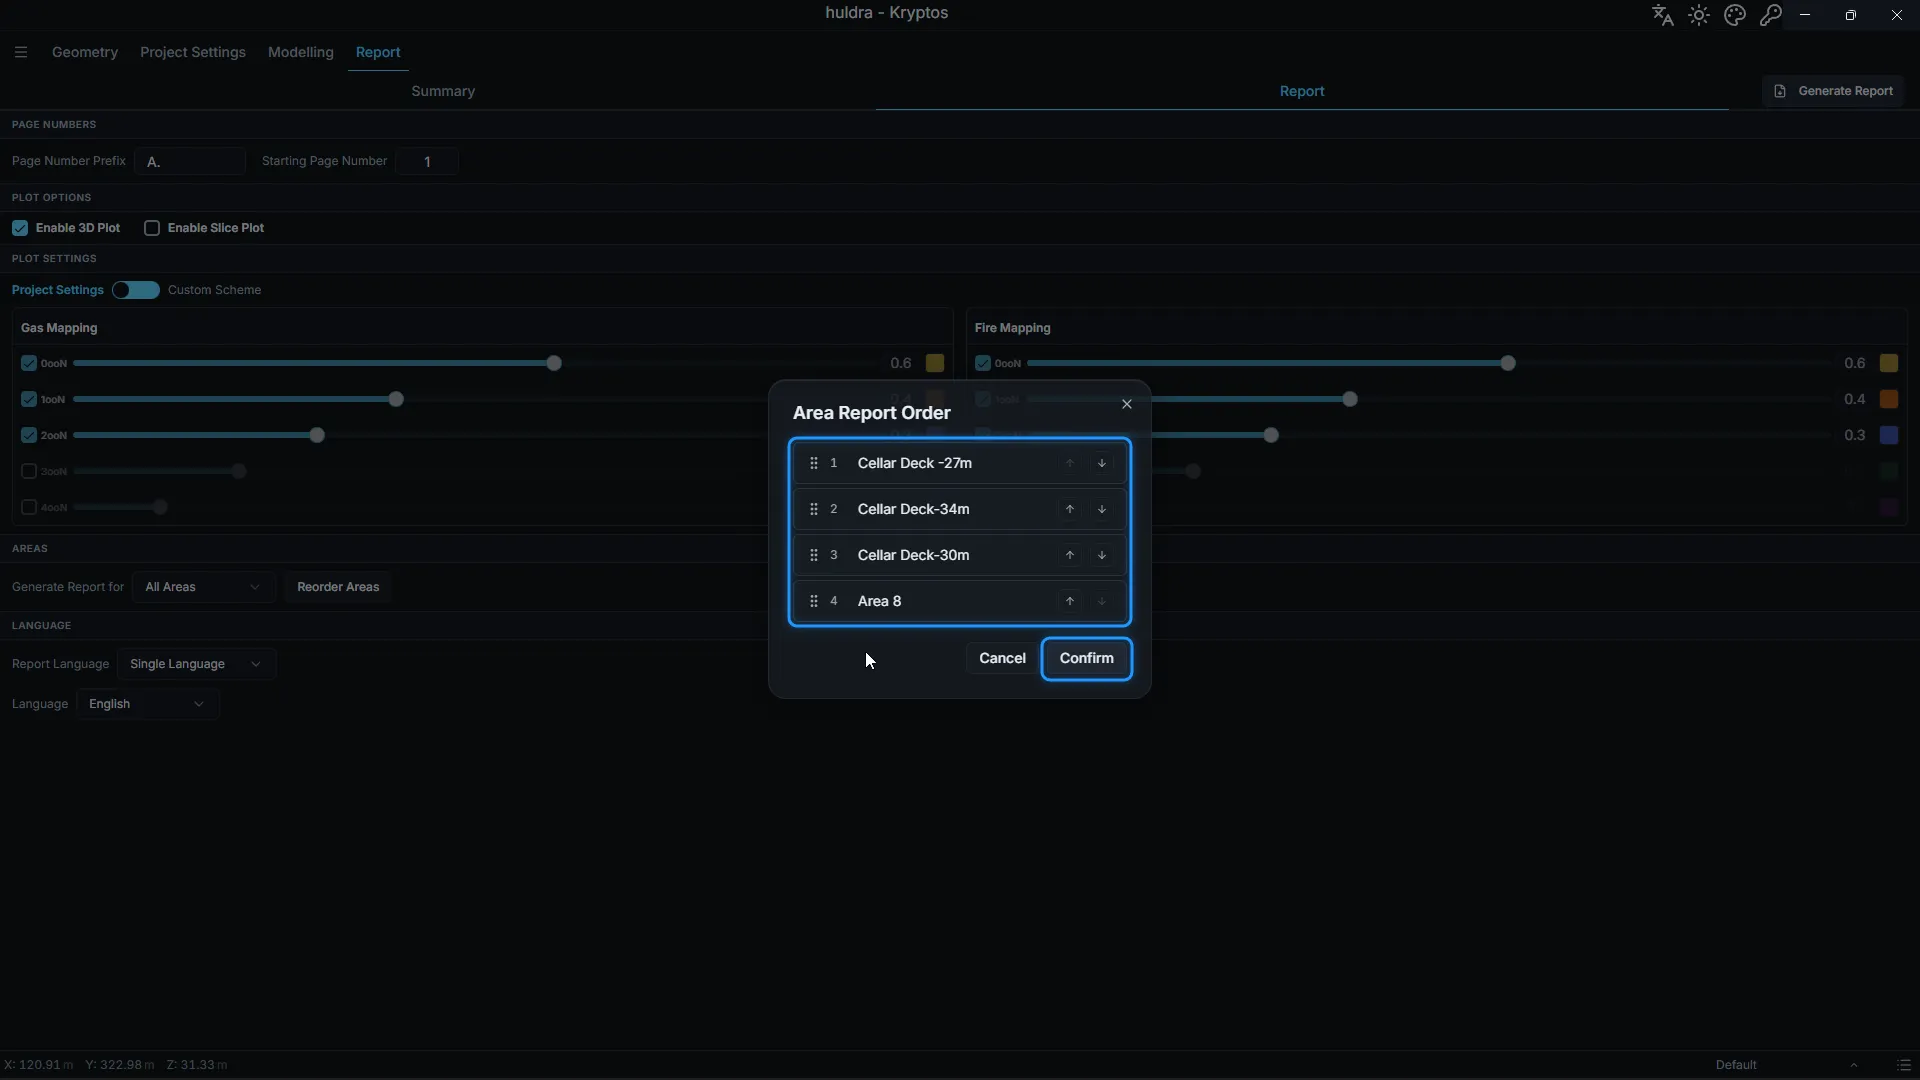
Areas appear in the report in the order you created them, which is rarely the order the client expects. Click Reorder Areas, then drag the areas by the handle on the left, or use the up and down arrows. Click Confirm to keep the new order, or Cancel to keep the old one.
Step 7: Language
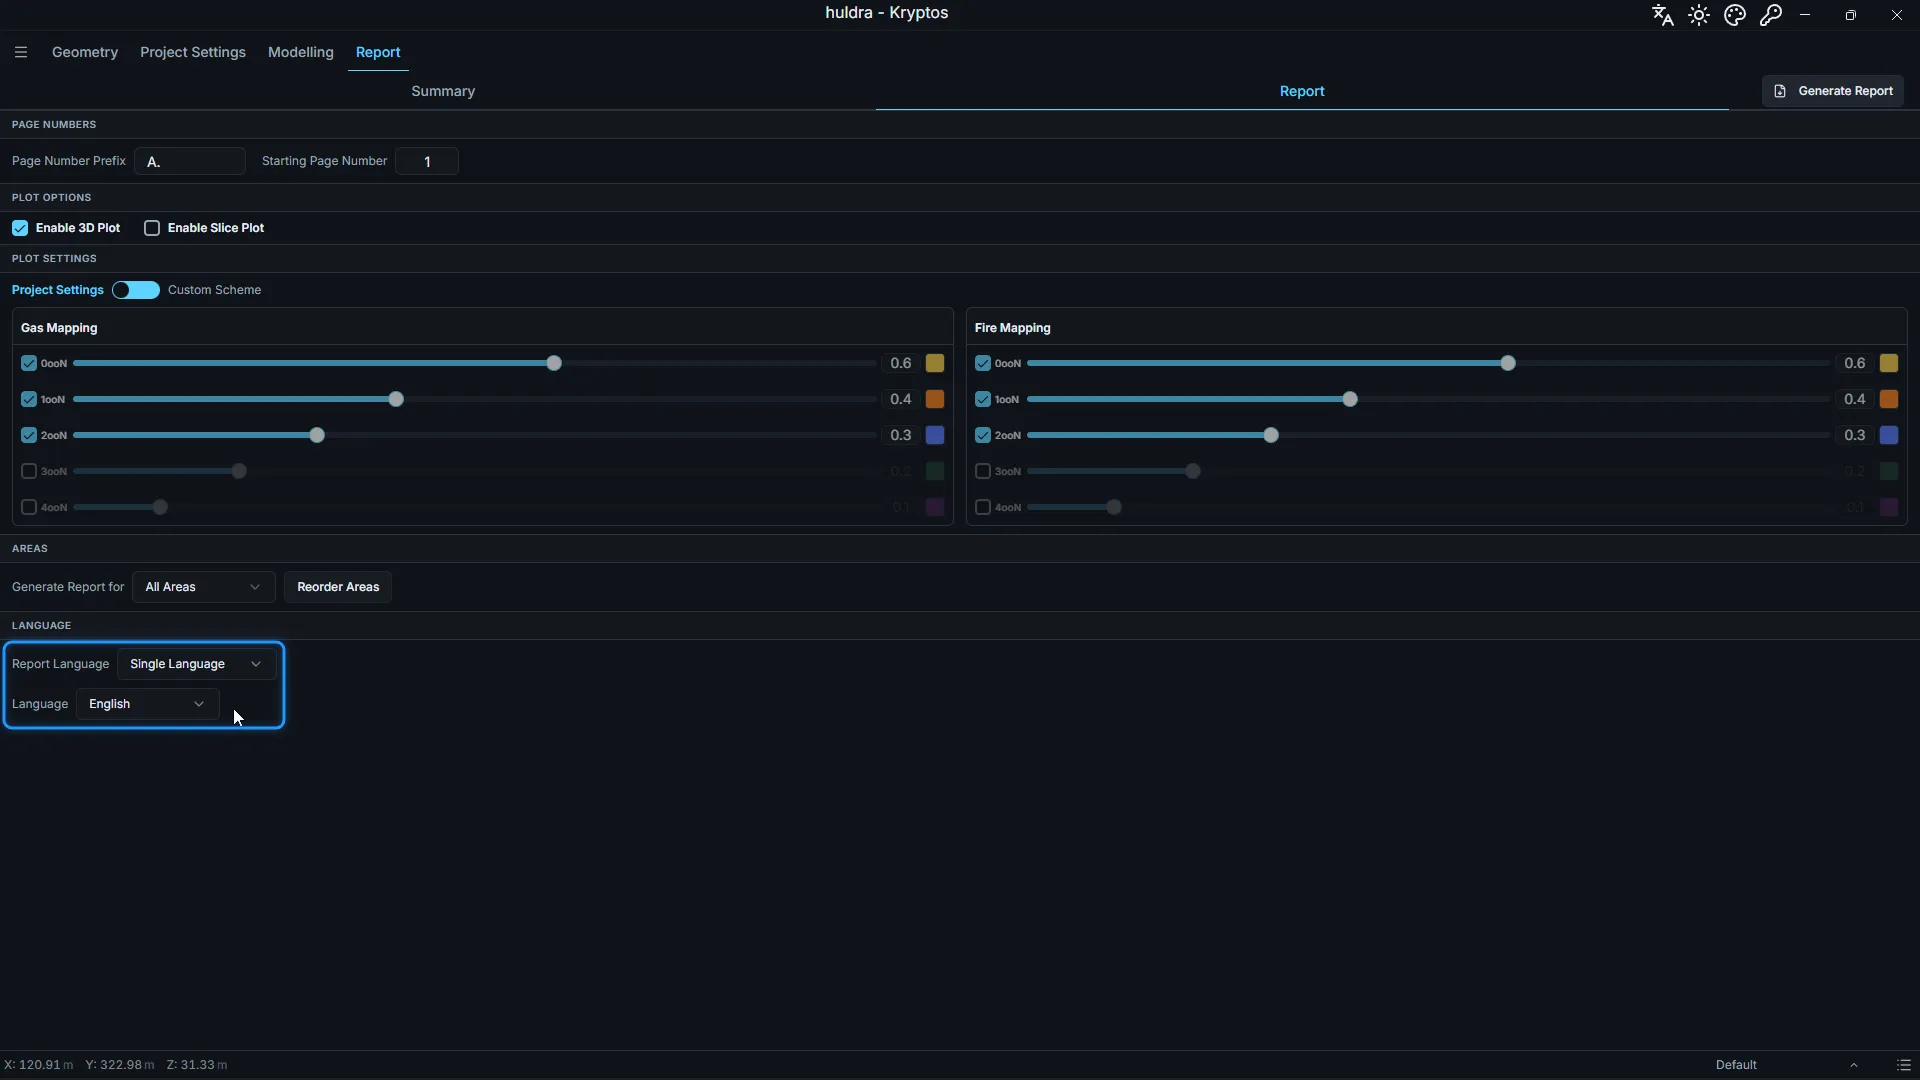
Under Language, choose Single Language or Multi Language in Report Language.
Single Language
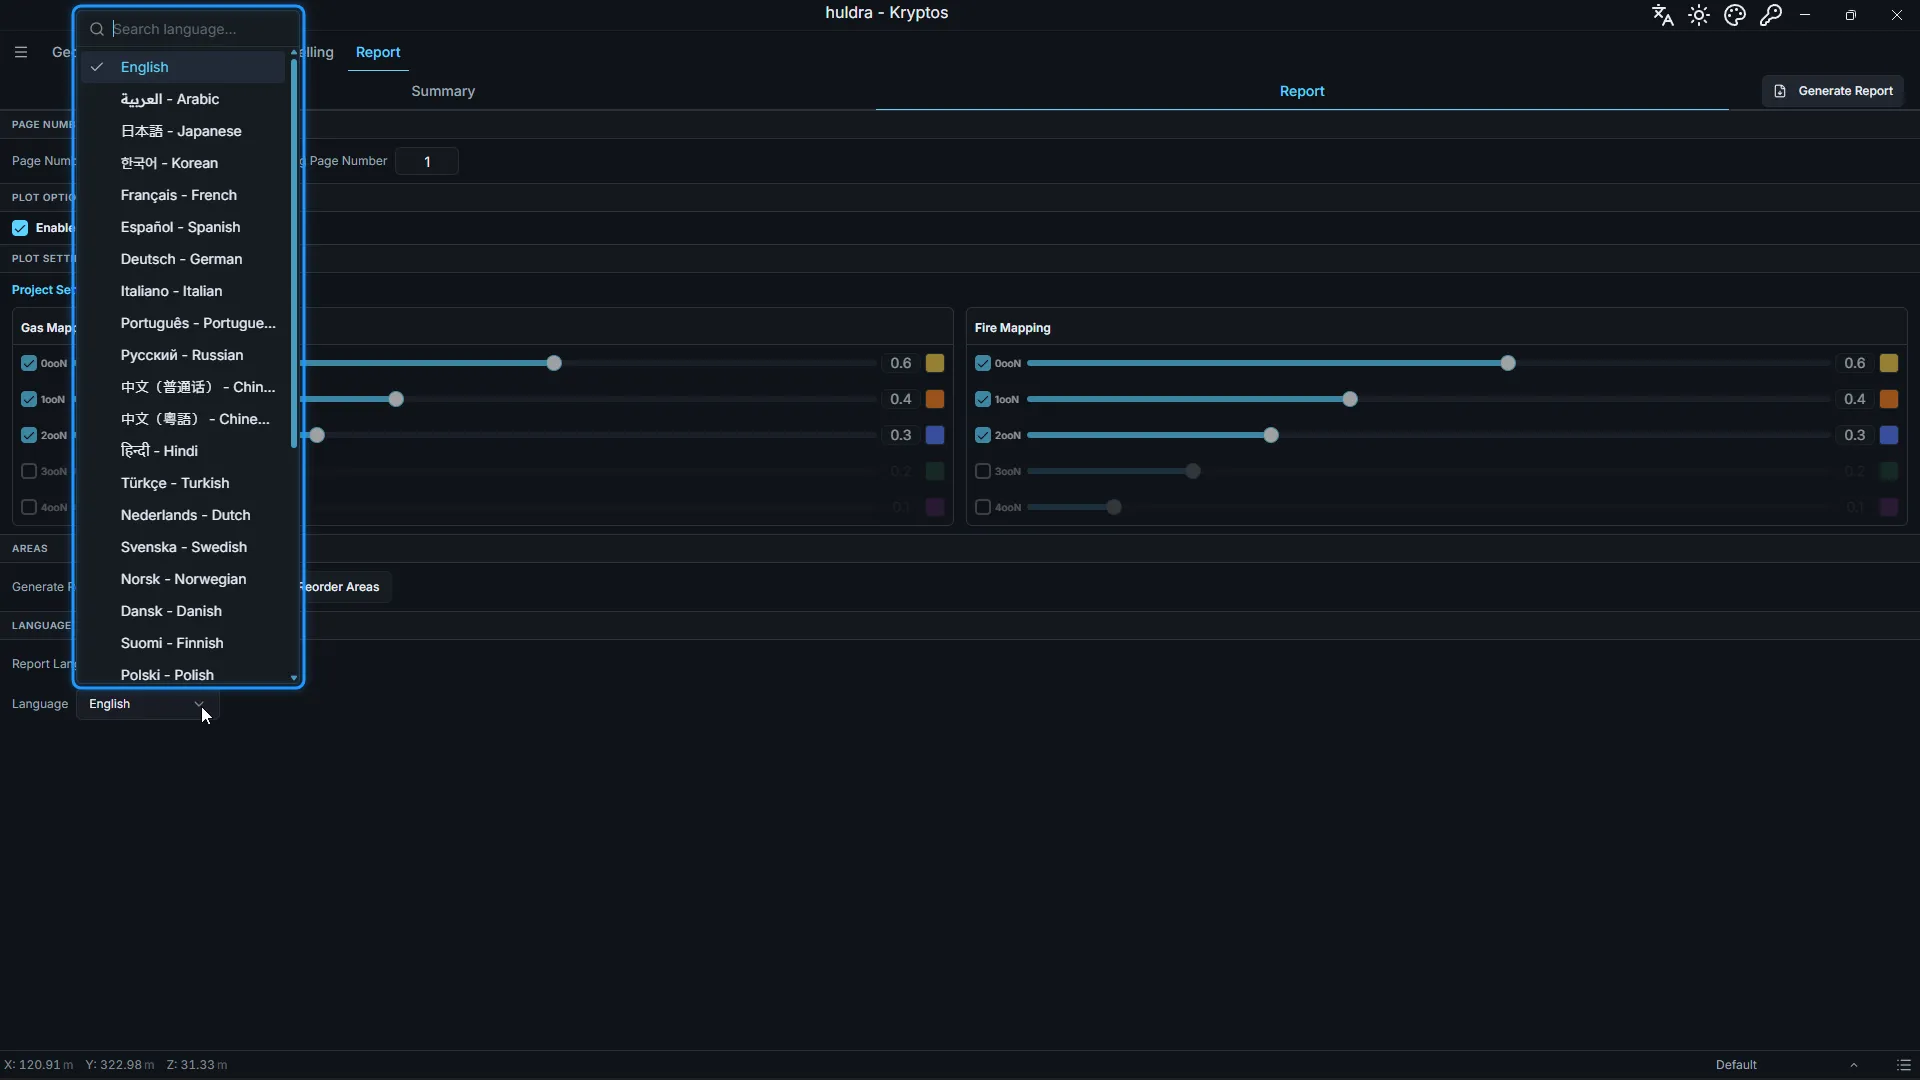
The whole report is written in one language. It starts with the language you use in Kryptos, and you can pick any of the 31. Each language is listed in its own script and in English, so you can find it either way. Type in the search box at the top to jump to one.
Here is the start of the same area, in three of them:
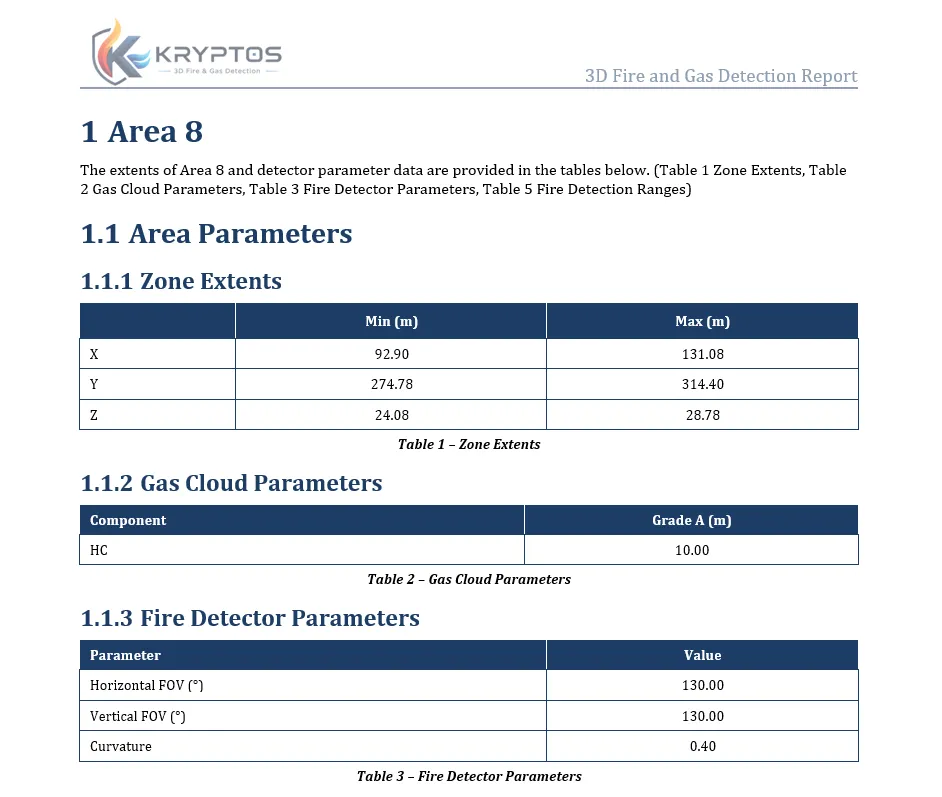
The report page in English.
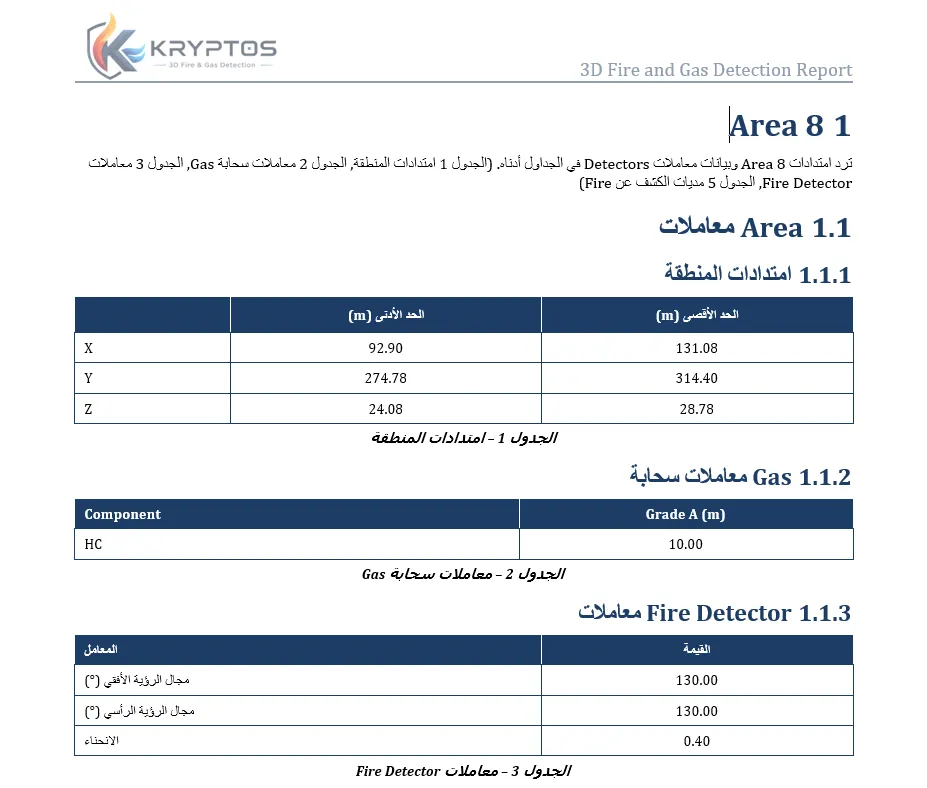
The same page in Arabic, laid out from right to left.
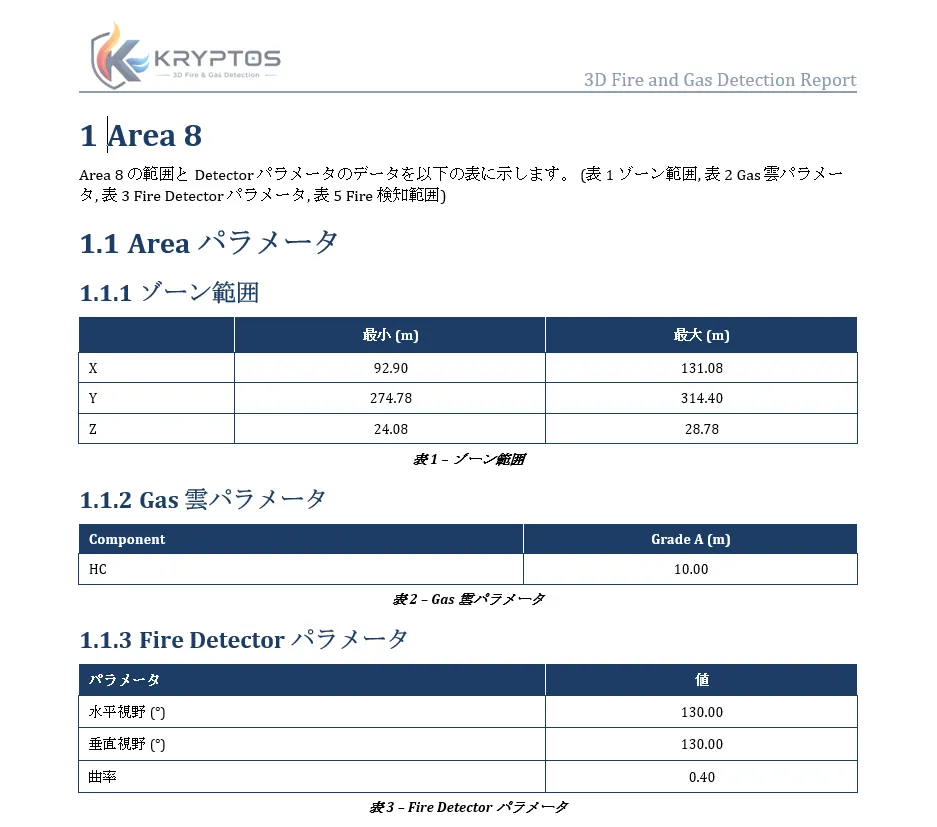
The same page in Japanese.
A few things to notice:
- Arabic and Hebrew are laid out from right to left. Headings, paragraphs and table text line up on the right, as a reader of those languages expects.
- Some industry terms stay in English, such as Area, Gas, Fire Detector and the grade names. These are the words engineers use on every project, in every country, and keeping them the same means a reader can always match the report to the drawings and the client’s own documents.
- Numbers, coordinates and units do not change between languages, so every value can be checked against the English version line by line.
- The report’s language never changes the language of the app.
Multi Language
The report is written in two languages in the same document. Choose Language 1 and Language 2.
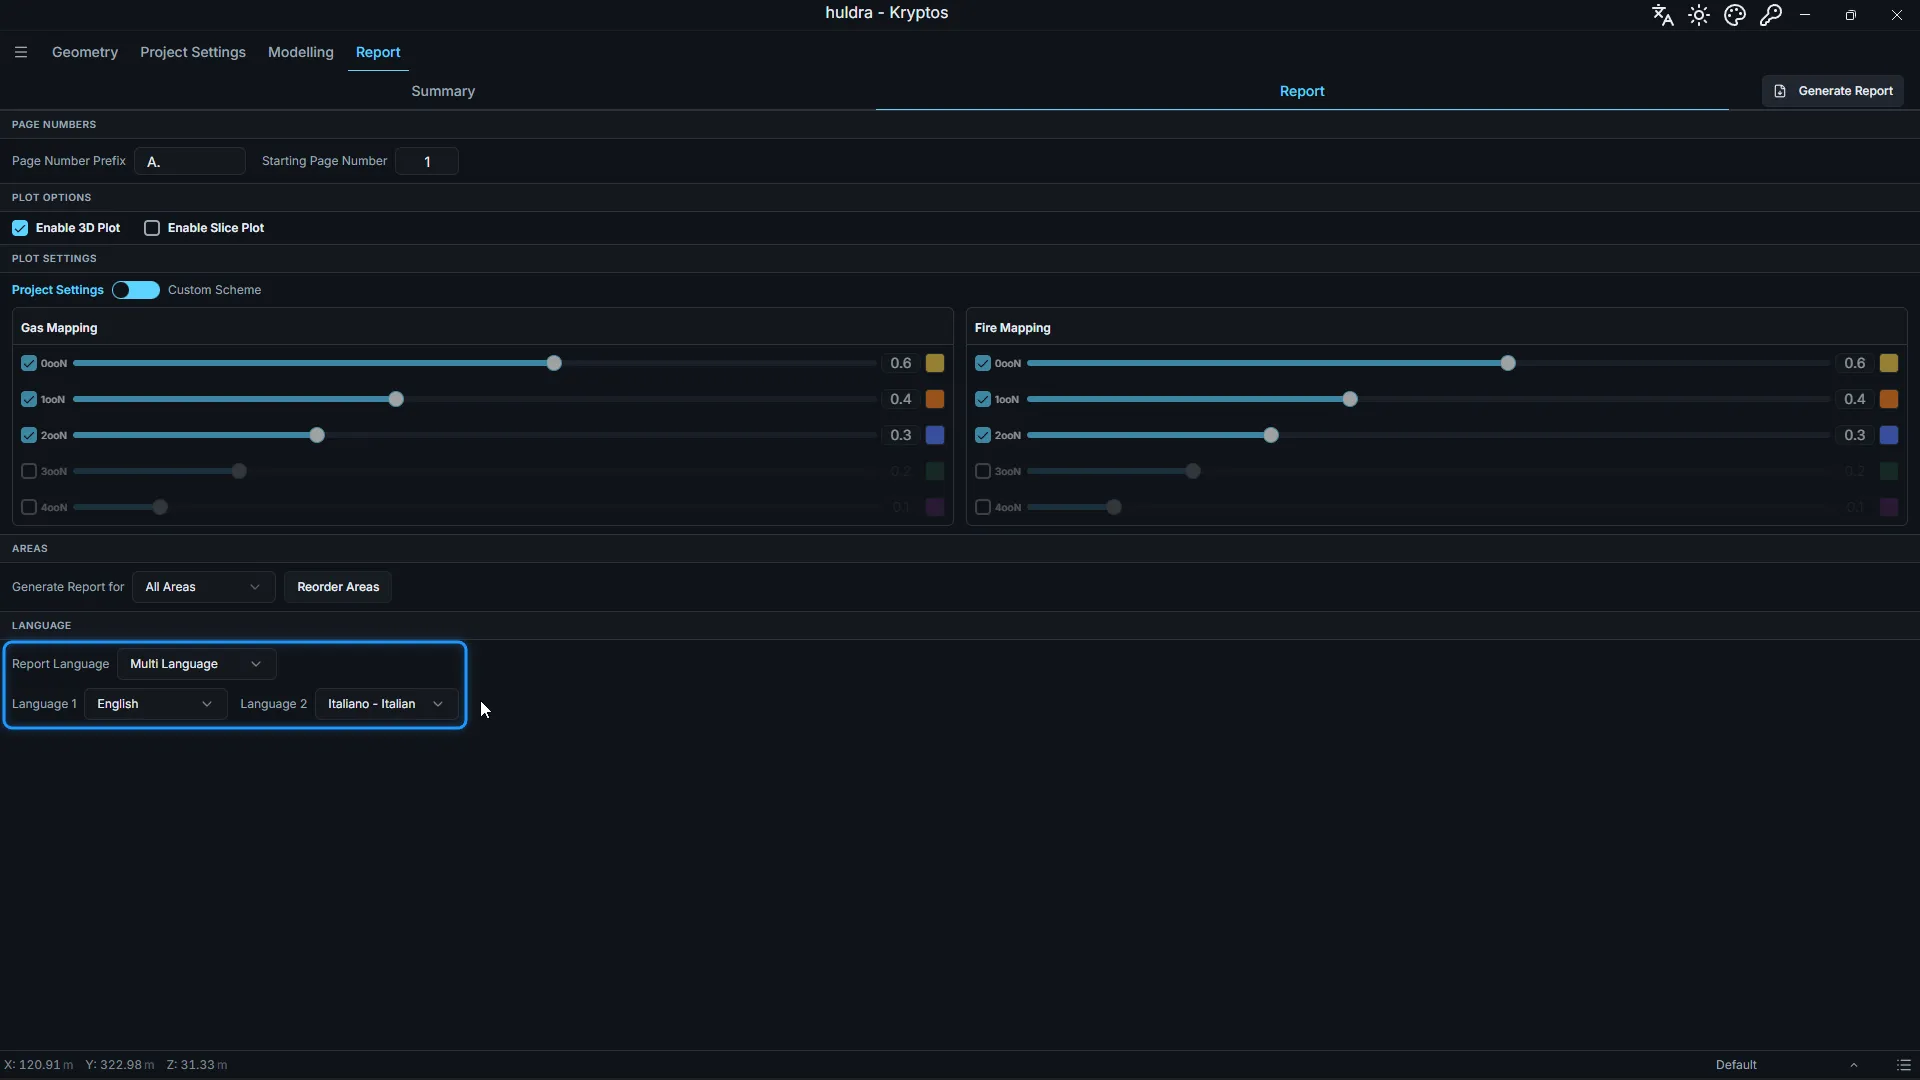
Every paragraph appears twice, Language 1 first and Language 2 under it. Every heading, table heading and caption shows both, split by a slash. One document then serves the client’s team and yours, and nobody has to compare two files page by page.
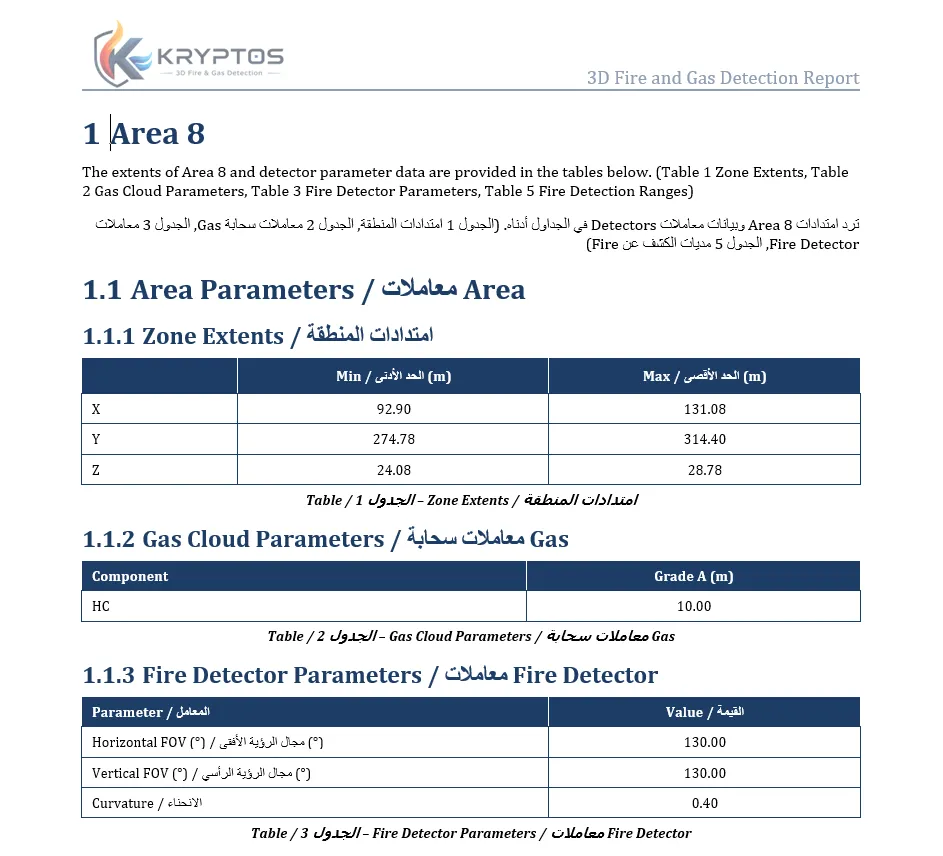
A two-language report page, English first and Arabic second.
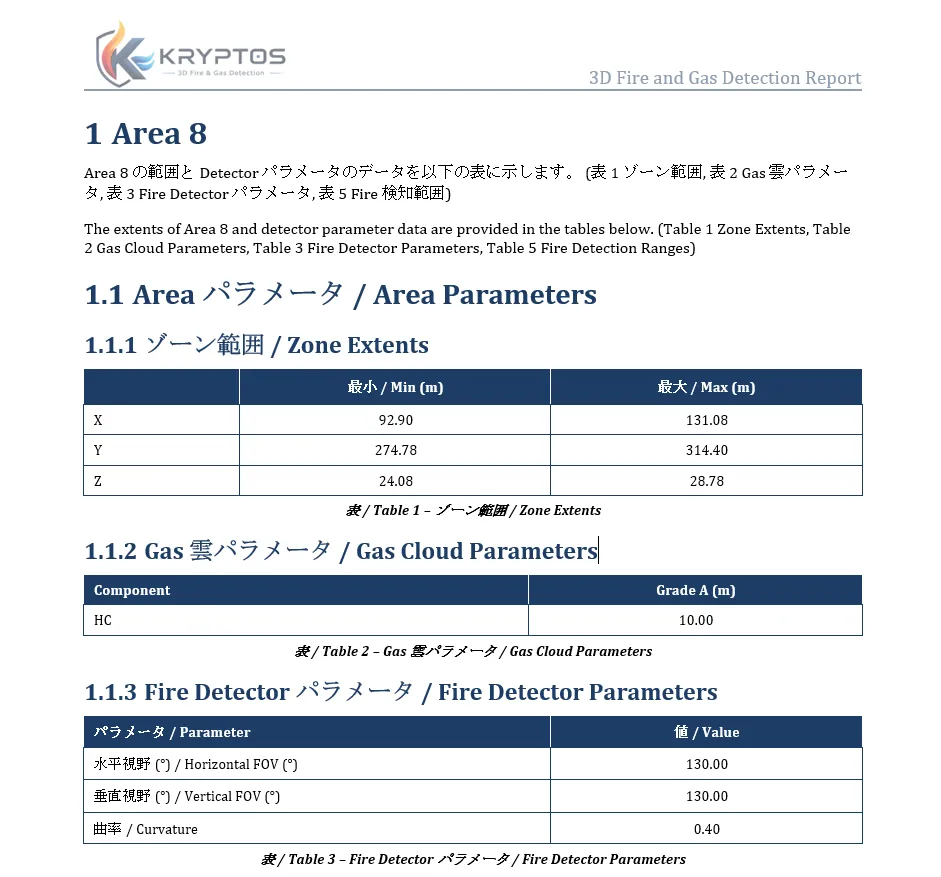
A two-language report page, Japanese first and English second.
Whichever language you choose as Language 1 comes first everywhere. Put the client’s language first if the report is mainly for them.
Step 8: Generate
- Click Generate Report and choose where to save the file.
- A window shows which area Kryptos is on and how far it has got. Leave the Kryptos window as it is while it works, since the pictures are taken from the 3D view.
- When Report saved successfully appears, open the file in Word.
If the file is already open in Word, Kryptos cannot replace it. Close it and click Generate Report again.
What is in the report
For every area you chose, in the order you set:
- Its name, its size on each axis (the Zone Extents table) and four views of the area.
- Its gas cloud sizes for each gas and grade, and for fire the detector, its field of view and its ranges.
- For each mapping, its grades, then for both the Preliminary Configuration and the Final Configuration: the coverage table, the detector list, pictures of the grades and the plots you switched on.
Every page has a header with the report title and logo, and a footer with the Kryptos version, the date and the page number. For every section, setting and message in detail, see Report in the Kryptos documentation.
Want the numbers too?
The Summary, next to Report on the same tab, shows the coverage and detector counts of every area on one screen. Click Export to Excel for the coverage and the detector lists of the whole project in one workbook. See Exporting to Excel for what each sheet holds.
Credits and acknowledgements
The plant model in this post is the Huldra platform, © Equinor ASA, used under Equinor’s Terms and Conditions. Our thanks to Equinor for making the Huldra data openly available, which lets us show Kryptos working on a real offshore platform.
Every screenshot that shows the model carries this credit. Equinor has not reviewed or endorsed this post or Kryptos.
Model credit: Huldra Platform © Equinor ASA | Used under Equinor's Terms and Conditions